Principles for building scalable infrastructure with AWS ECS


Introduction
Scaling containers with AWS ECS is hard. Scaling with spiky traffic is even harder.
This guide covers my real-world experience in scaling a platform with very sudden and spiky traffic patterns.
The platform is a consumer-facing product running PHP (Symfony) and Next.js on Fargate behind an Application Load Balancer.
I believe that these principles are universal across different programming languages and tech stacks, so I decided to write them down so I could better handle similar scaling challenges in the future.
I tried to present these principles in such a way that they would be technology agnostic so you could use them for your project as well.
Let's dive in.
1. Use IAC
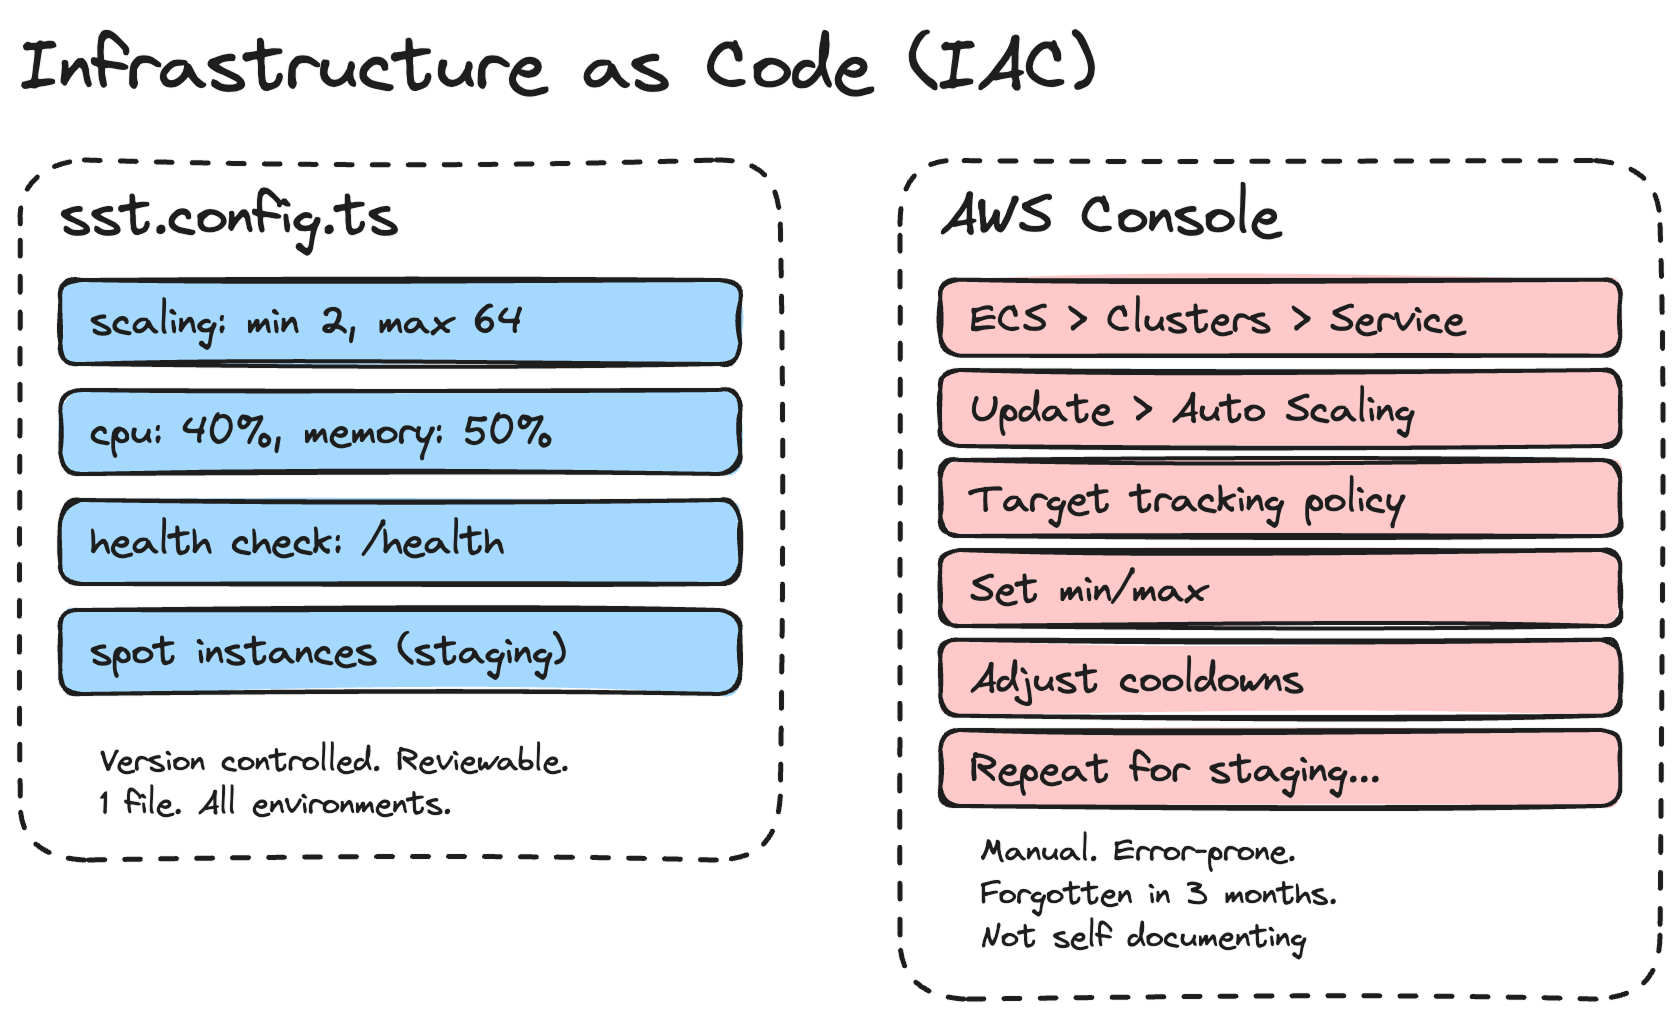
1.1 What is IAC?
IAC stands for Infrastructure as Code. It's a way to define the components your infrastructure uses without doing it manually in a UI based dashboard.
1.2 Why I recommend using IAC
Using IAC helps me manage complex infra configurations much faster than adjusting them manually.
When you're running multiple services, each with its own scaling policies, health checks, VPC configs, and environment variables, doing this by clicking through the AWS Console is a recipe for mistakes.
1.3 Which IAC tool should I use?
I use SST, but Pulumi and Terraform are also good options.
Here's an example. This is how I define my ECS service scaling in SST:
scaling: {
   min: $app.stage === "production" ? 2 : 1,
   max: $app.stage === "production" ? 64 : 2,
   cpuUtilization: 40,
   memoryUtilization: 50,
},
That's 6 lines.
In the AWS Console, this would involve navigating through ECS → Service → Update → Auto Scaling, configuring target tracking policies, setting the min/max, and adjusting cooldowns.
And then doing it again when you want to change something. And then forgetting what you changed 3 months later.
With IAC, I can also have different configurations per environment. Staging uses spot instances with a max of 2 containers. Production uses on-demand instances with a max of 64. It's all in one file, version-controlled, and reviewable in a pull request.
// Staging: cheap, good enough for testing
  capacity: $app.stage !== "production" ? {
  spot: true,
} : undefined,

// Production: reliable, scales to handle traffic spikes
scaling: {
  min: 2,
  max: 64,
  cpuUtilization: 40,
  memoryUtilization: 50,
},
2. Understand that web services tend to be CPU-bound, not RAM-bound
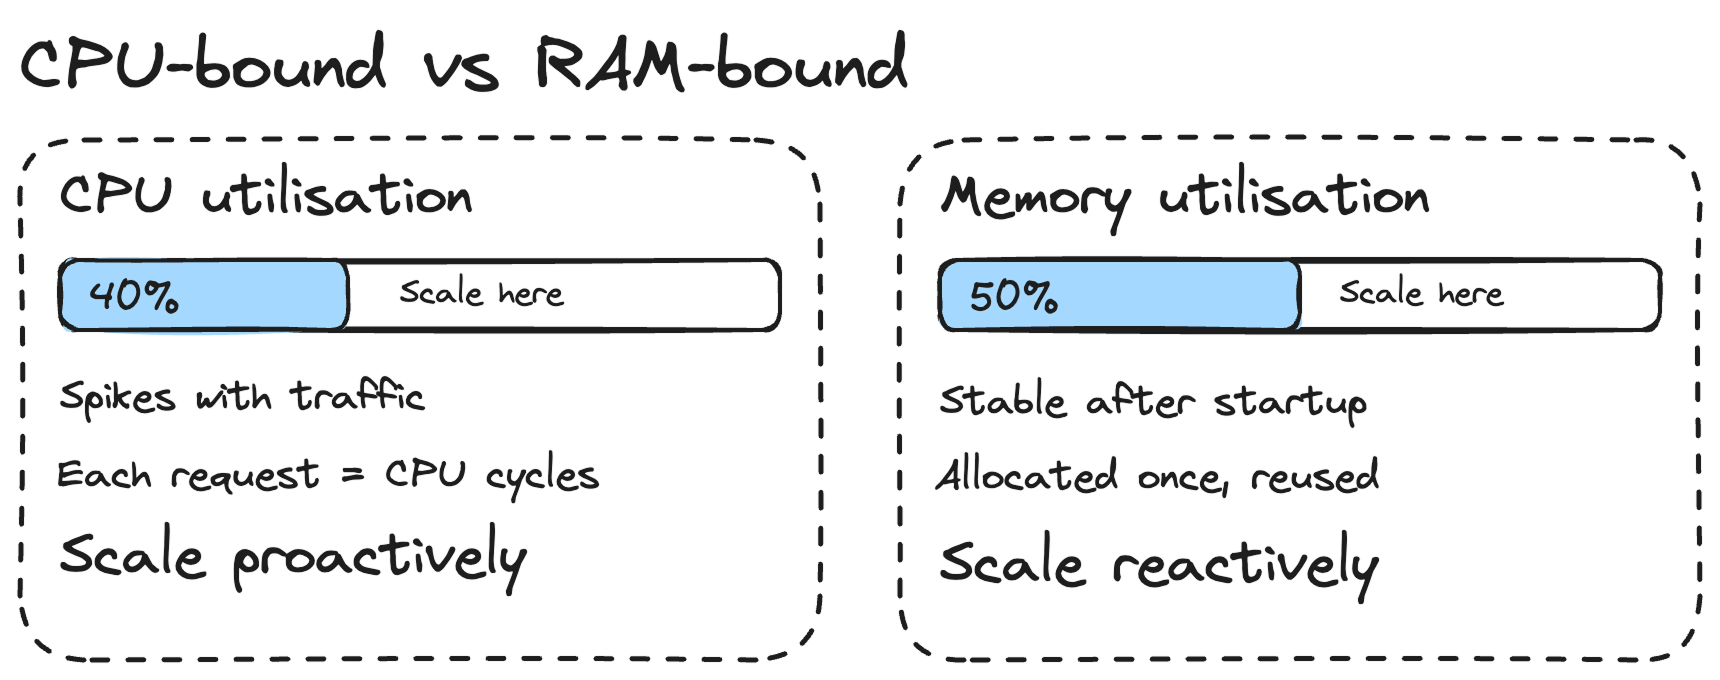
Because of that, I use lower scaling values for CPU than for memory. In my setup, I scale at 40% CPU utilisation but 50% memory utilisation.
Why lower for CPU? Because when traffic spikes, your CPU is the first to get hammered. Each incoming request needs CPU cycles to process. RAM usage stays relatively stable because your application allocates memory once at startup and reuses it across requests.
If you're seeing RAM go up steadily over time, it's likely a memory leak, not a sign that you need to scale out. I've seen this happen with PHP applications where objects aren't being garbage-collected properly. Don't throw more containers at a memory leak. Fix the leak.
In short: scale proactively on CPU (lower threshold, so new containers are ready before existing ones get overwhelmed) and reactively on memory (higher threshold, because memory usage is more predictable).
3. Keep the container entry points light
It's important to have containers get up and running as fast as possible. When traffic spikes, ECS needs to spin up new containers. If your container takes 2 minutes to start, that's 2 minutes of degraded performance for your users.
I learned this the hard way. My PHP container's entry point script does several things: generates JWT key pairs, validates SSL certificates, starts PHP-FPM, waits for it to be ready, tests the database connection, warms the Symfony cache, and then starts Nginx.
# Generate JWT keys
php bin/console lexik:jwt:generate-keypair --skip-if-exists

# Start PHP-FPM in background
php-fpm -D

# Wait for PHP-FPM (up to 30 attempts)
until nc -z 127.0.0.1 9000; do
sleep 1
done

# Test database connection
php bin/console doctrine:query:sql "SELECT 1"

# Warm cache
php bin/console cache:warmup --env=prod

# Start Nginx in foreground
nginx -g "daemon off;"
Some of that is unavoidable. But I moved database migrations out of the entry point entirely. They now run as a one-off Fargate task in CI/CD, after the deployment has stabilised.
- name: Run migrations
run: |
TASK_ARN=$(aws ecs run-task \
--cluster "$CLUSTER_ARN" \
--task-definition "$TASK_DEF_ARN" \
--network-configuration "..." \
--overrides '{
"containerOverrides": [{
"name": "middleware",
"command": ["php", "bin/console", "doctrine:migrations:migrate", "--no-interaction"]
}]
}' \
--query 'tasks[0].taskArn' \
--output text)
aws ecs wait tasks-stopped --cluster "$CLUSTER_ARN" --tasks "$TASK_ARN"
This means my containers don't need to run migrations on startup, which removes a slow and potentially dangerous step from the entrypoint. If you had 10 containers starting at the same time, you definitely don't want all of them trying to run migrations simultaneously.
4. Understand the different ALB balancing strategies
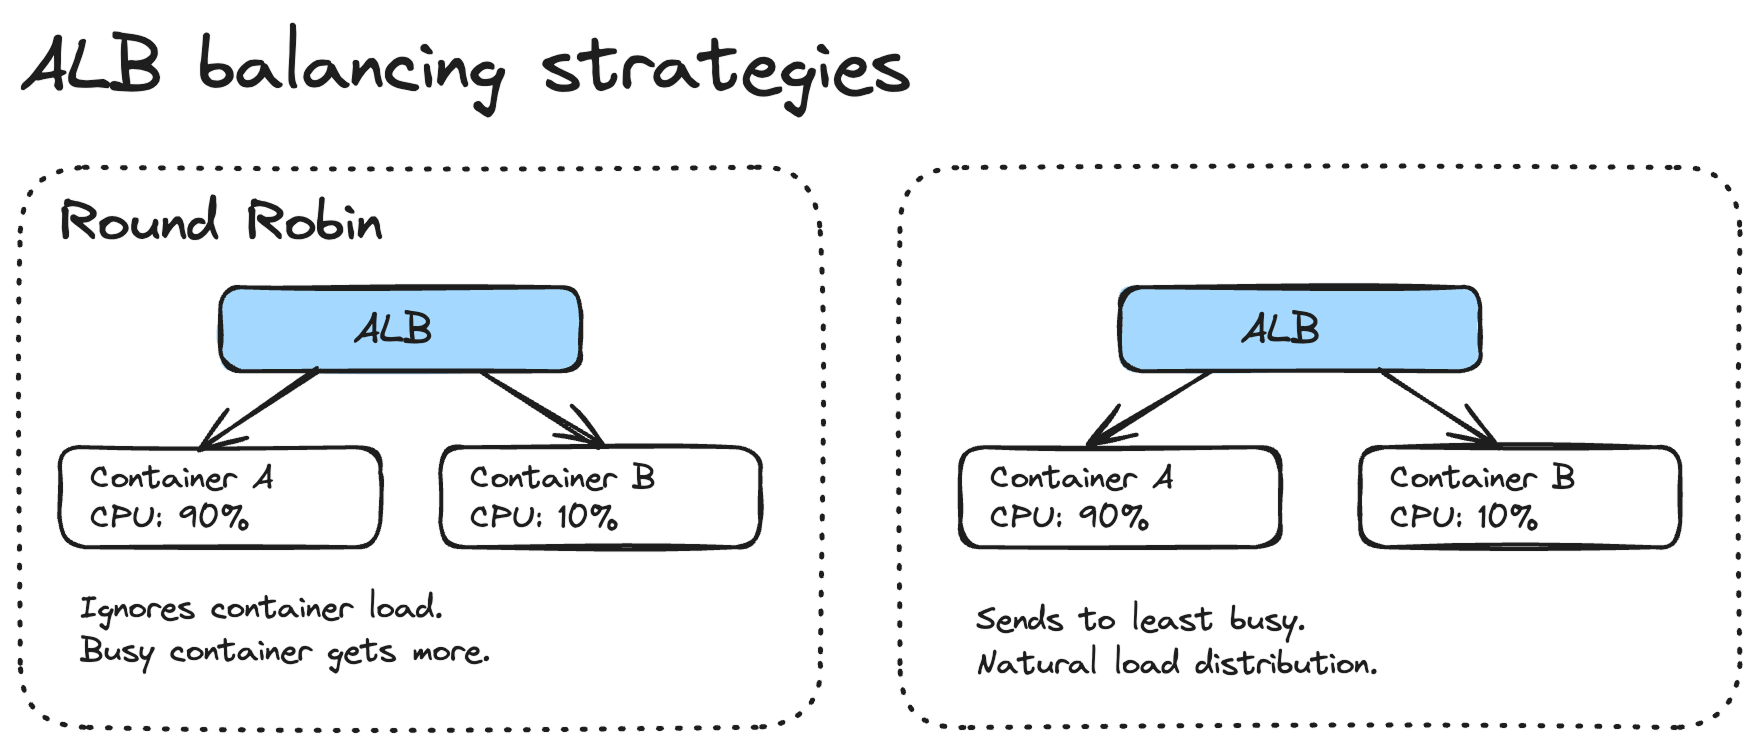
Round Robin is a bad default for ECS services.
The problem with Round Robin is that it doesn't account for how busy each container is. If one container is processing a heavy request and another is idle, Round Robin will happily send the next request to the busy container. This gets worse with tasks that have variable processing times.
Look into the Least Outstanding Requests instead. It sends traffic to the container with the fewest in-flight requests, which naturally distributes the load more evenly.
Another thing worth considering is the slow start mode on your target group. When a new container registers with the ALB, slow start gradually increases the traffic it receives over a configurable period. Without it, a fresh container can get hammered with requests before it's fully warmed up, which is especially bad for PHP applications that need to build their OPcache.
5. Consider that scaling happens within individual containers as well, not just across the fleet
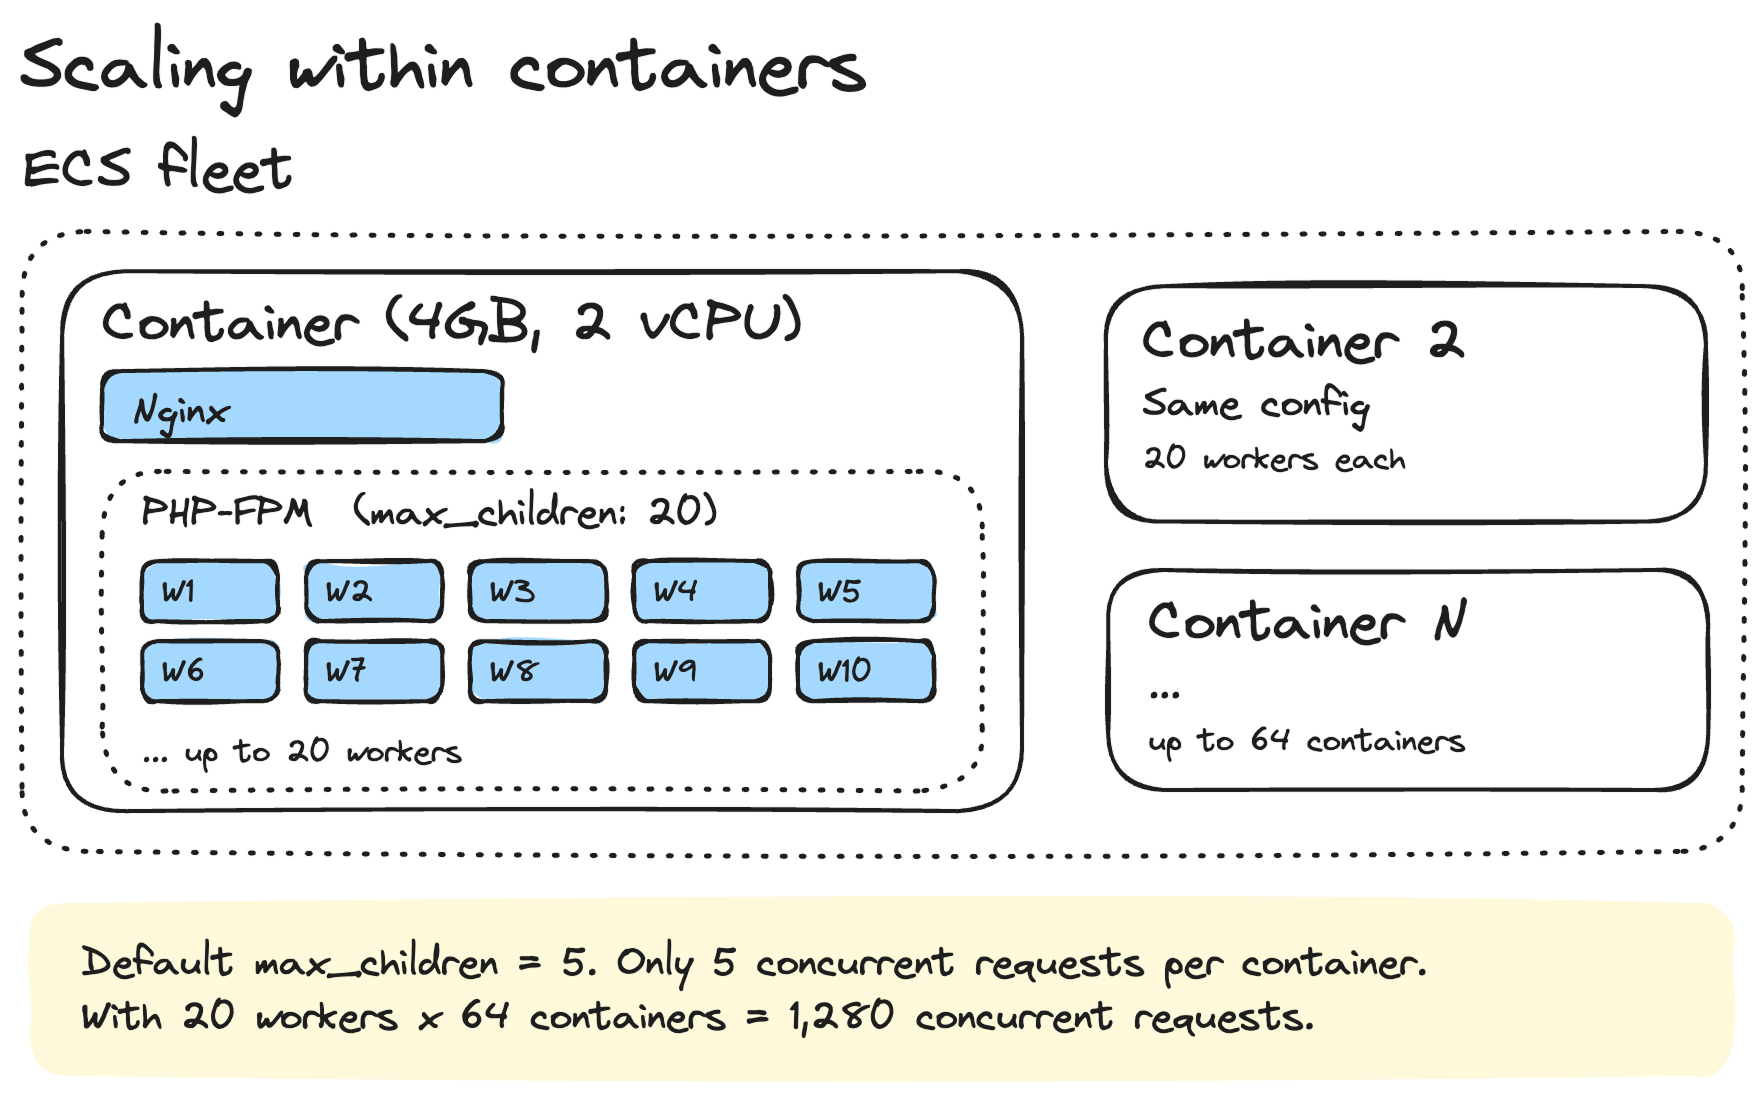
This is something that catches a lot of people off guard. You can have the perfect ECS scaling policy, but if the process manager inside your container is misconfigured, you'll hit a ceiling way before ECS even thinks about adding new containers.
PHP-FPM's default settings are way too low for production. Here's what I use:
pm = dynamic
pm.max_children = 20
pm.start_servers = 5
pm.min_spare_servers = 3
pm.max_spare_servers = 10
pm.max_requests = 500
request_terminate_timeout = 60s
The default `max_children` is typically 5. That means your container can only handle 5 concurrent PHP requests. On a 2 vCPU, 4GB memory container, you're leaving a lot of capacity on the table.
I set `max_children` to 20 because each PHP-FPM worker uses roughly 30-50MB of memory in my application. With 20 workers, that's about 600MB-1GB for PHP-FPM, leaving plenty of headroom on a 4GB container for Nginx, the OS, and the OPcache.
The `max_requests = 500` setting is also important. It recycles workers after 500 requests, which helps prevent memory leaks from accumulating over time.
This applies to other runtimes too. If you're running Node.js, make sure you're using clustering or a process manager. If you're running Python with Gunicorn, tune your worker count. The container is just a box. What runs inside it matters just as much.
6. Use a minimum of 2 containers in production
This is non-negotiable for me.
First, you need it for rolling deploys. When you push a new version, ECS starts new containers and drains the old ones. If you only have 1 container, there's a moment where your service is either down or serving from an old version while the new one starts up.
With 2 containers minimum, ECS can do a proper rolling deployment. It spins up a new container, waits for it to pass health checks, then drains the old one. Your users never notice.
scaling: {
min: $app.stage === "production" ? 2 : 1,
max: $app.stage === "production" ? 64 : 2,
},
Second, it's basic reliability. Containers crash. Hosts fail. If your single container goes down, your service is offline until ECS replaces it, which can take a minute or two. With 2 containers spread across availability zones, you can survive a container failure without any downtime.
For staging, 1 container is fine. I also use spot instances there to save money. But production always gets at least 2 on-demand instances.
## Wait for ECS to stabilise to see the real CI/CD duration
One thing that confused me early on was that my GitHub Actions workflow would show "deploy complete" but the service wasn't actually ready yet. SST (or any IAC tool) finishes deploying the task definition and updating the service, but ECS still needs to pull the image, start the containers, run health checks, and drain the old containers.
Here's the GitHub Actions snippet I use to wait for stabilisation:
- name: Wait for ECS service to stabilise
run: |
CLUSTER_ARN=$(aws ecs list-clusters --query "clusterArns[?contains(@, '${{ env.SST_STAGE }}')]" --output text)
SERVICE_ARN=$(aws ecs list-services --cluster "$CLUSTER_ARN" --query "serviceArns[0]" --output text)
echo "Waiting for service to stabilise..."
aws ecs wait services-stable --cluster "$CLUSTER_ARN" --services "$SERVICE_ARN"
echo "Service is stable."
`aws ecs wait services-stable` polls the service until the running count matches the desired count and all health checks pass. This gives you the real end-to-end deployment time in your CI/CD logs, which is important for planning your deployment strategy.
In my case, a typical production deployment takes about 10-15 minutes end to end. The SST deploy itself is 3-4 minutes, and the rest is ECS stabilisation. Knowing this helps me plan. If I need a hotfix out fast, I know it's going to take at least 10 minutes. And I also set a 15-minute timeout so the workflow doesn't hang forever if something goes wrong.
- name: Wait for ECS service to stabilise
timeout-minutes: 15
run: |
aws ecs wait services-stable --cluster "$CLUSTER_ARN" --services "$SERVICE_ARN"
Another thing: after stabilisation, is when I run database migrations. Not before, not during. After. This way, the new code is running and healthy before any schema changes happen.
7. Use generous scale-out policies to stop yo-yoing
This one took me a while to get right. Without proper cooldown settings, your fleet will yo-yo — scaling up when traffic spikes, scaling back down the moment it dips, then scaling up again seconds later. Every scale event has a cost: new containers need to start, pass health checks, and warm up. If that's happening every few minutes, your service is constantly in a degraded state.
Here's what I use:
scaling: {
  min: 2,
  max: 64,
  cpuUtilization: 40,
  memoryUtilization: 50,
  scaleInCooldown: '720 minutes',
  scaleOutCooldown: '0 seconds',
},
The key numbers here are:
Scale out cooldown: 0 seconds. When traffic spikes, I want new containers immediately. There's no reason to wait. The platform I run has sudden, unpredictable traffic patterns. A delay of even a few minutes means degraded performance for real users.
Scale in cooldown: 720 minutes (12 hours). This is the important one. Once containers are running, I keep them running for at least 12 hours before ECS is allowed to remove them. Traffic on the platform tends to come in waves throughout the day. If I let ECS scale down aggressively between waves, it'll just have to scale back up again 30 minutes later. By keeping the containers warm, the next wave is absorbed instantly.
I also have an isScaledUp flag in the config. When I know a big event is coming, I flip it to true and the minimum goes from 2 to 8 containers. This is a manual lever, but it's saved me from scrambling more than once. After the event, I flip it back.
For staging, the cooldowns are much shorter because I don't care about
scaling: {
  min: 1,
  max: 2,
  scaleInCooldown: '360 seconds',
},
capacity: 'spot',
The principle is: scale out fast, scale in slow. You're paying a bit more for idle containers, but you're avoiding the constant churn of containers starting and stopping. In my experience, the extra cost is worth it for the stability.
8. Monitor consistently
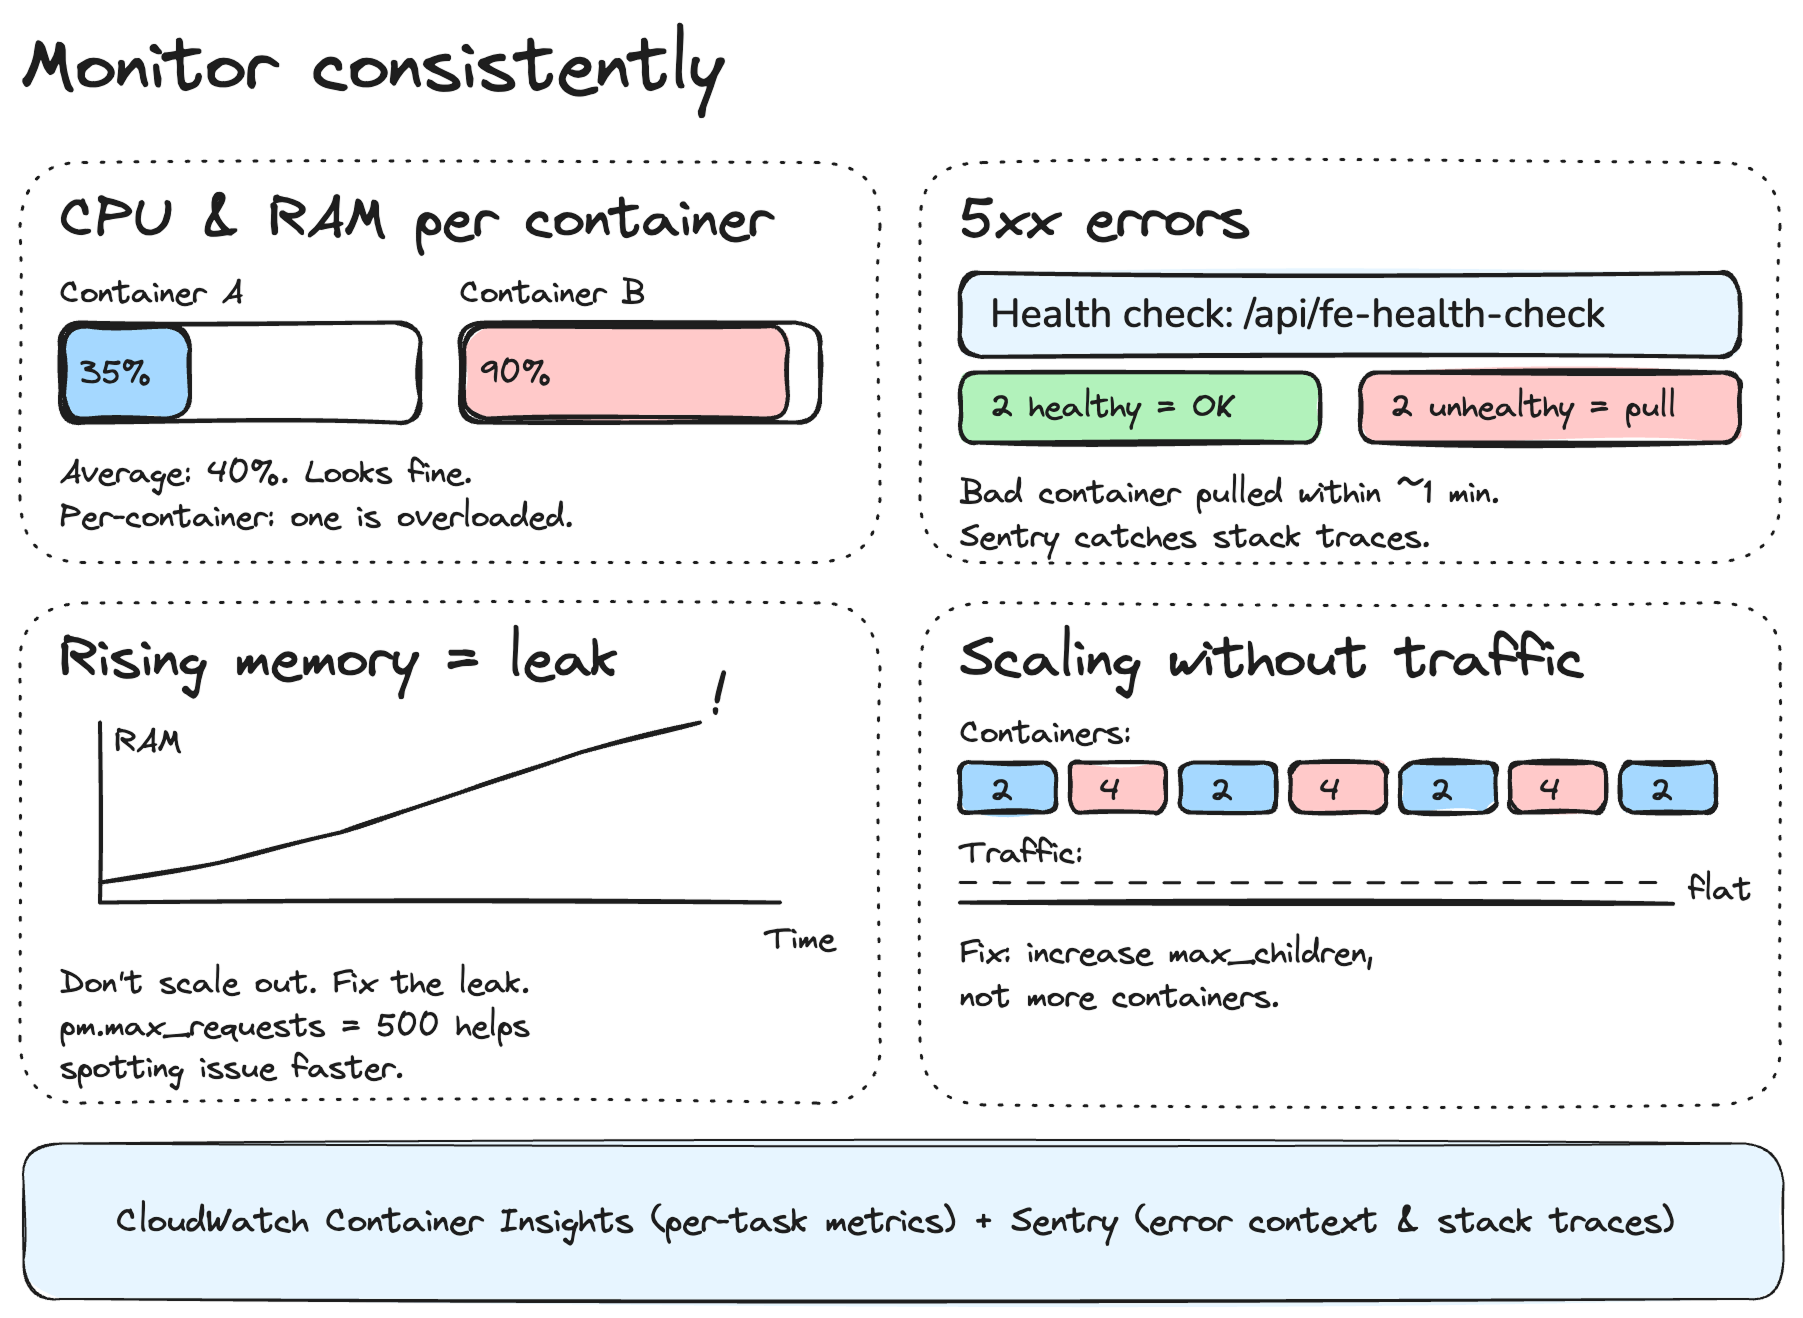
All the scaling policies in the world won't help you if you're not watching what's actually happening. I've learned to pay attention to a few specific signals that tell me whether the fleet is healthy or whether something needs fixing.
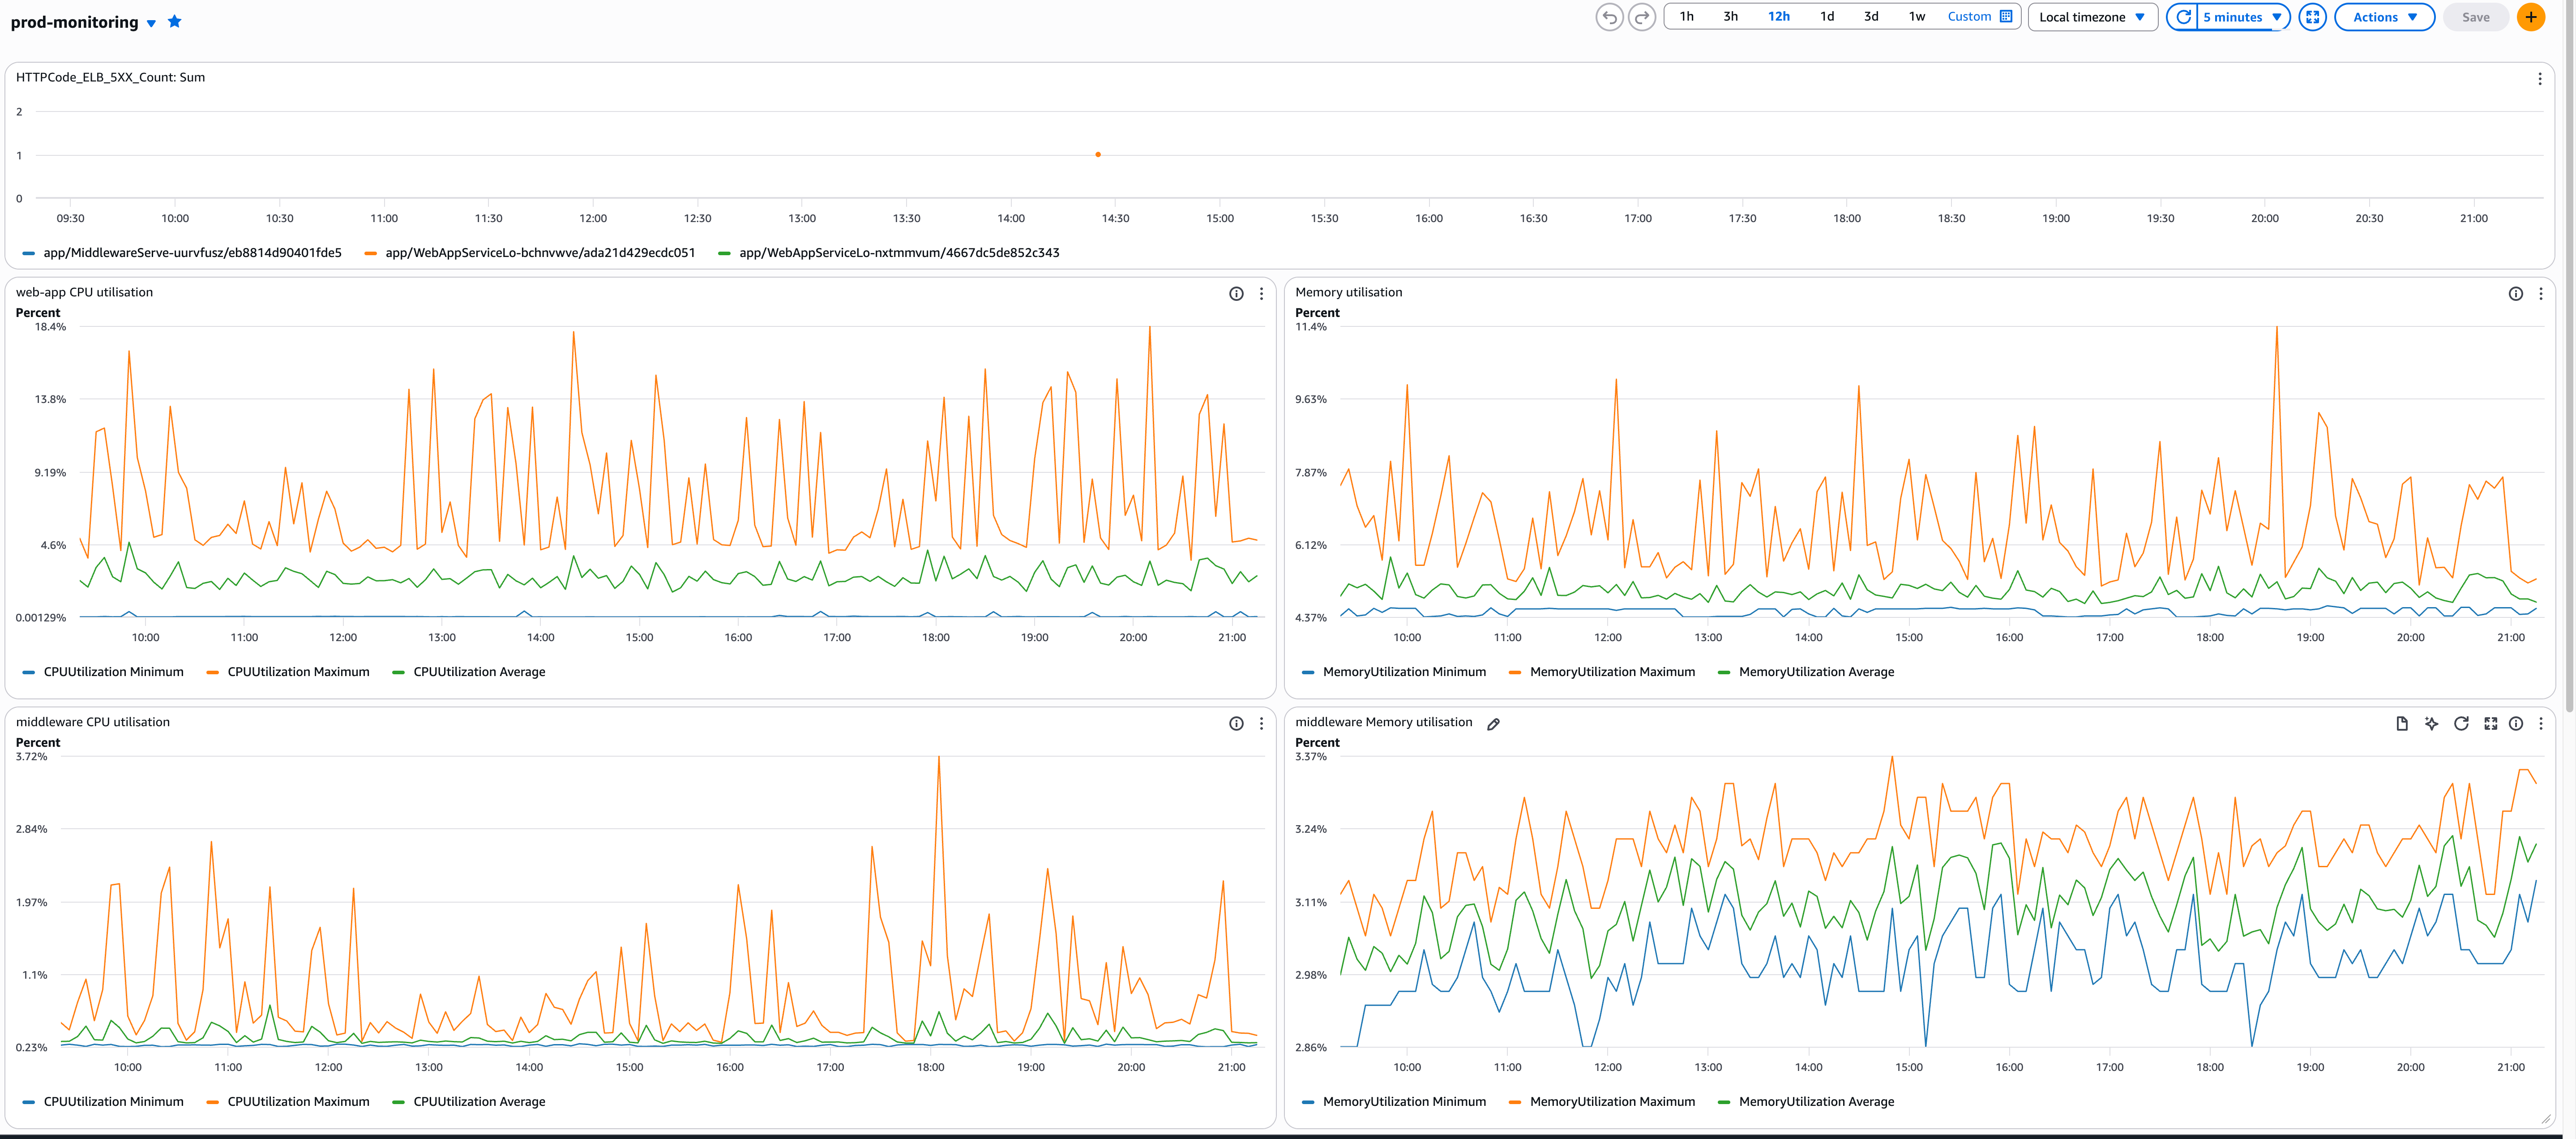
Monitor CPU and RAM usage across the fleet.
Not just averages — look at per-container metrics. An average of 40% CPU across 10 containers can hide one container sitting at 95% while others are idle. That's usually an ALB distribution problem or a long-running request blocking a worker.
I use CloudWatch Container Insights for this. It gives you per-task CPU and memory, which is what you actually need. The ECS service-level average is useful for autoscaling, but useless for debugging.
Monitor 5xx errors
This is the most obvious one, but it's worth saying. A spike in 500 errors often means a container is unhealthy but hasn't failed enough health checks yet to be replaced. The health check config I use catches this fairly quickly:
health: {
  '3000/http': {
    path: '/api/fe-health-check',
    interval: '30 seconds',
    timeout: '5 seconds',
    healthyThreshold: 2,
    unhealthyThreshold: 2,
    successCodes: '200-399',
  },
},
Setup a Clodwatch monitoring dashboard
Need help scaling your AWS infrastructure?
Let's discuss this in a free 30-minute discovery call.